The live Hyperliquid market race
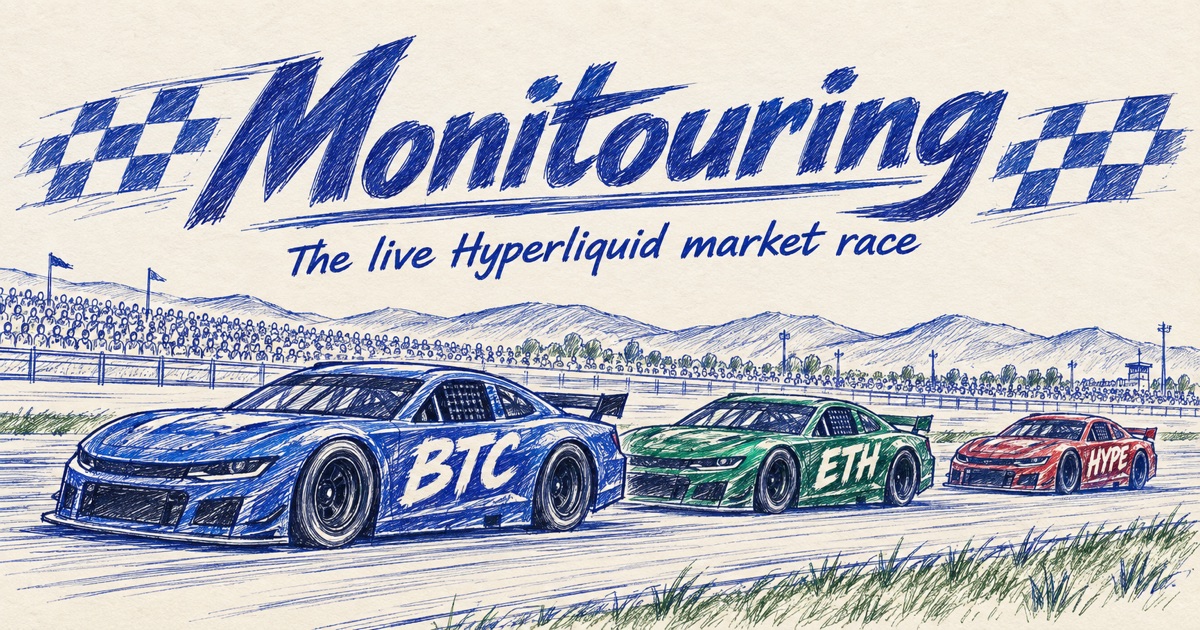
Monitouring is a free market visualization that turns Hyperliquid perpetual contract performance into a live 3D stock-car race. Each car represents a market. The standings rank percentage price changes over your selected period.
Which markets race?
All includes eligible Hyperliquid perpetual contracts across the native exchange and builder-deployed DEXs. Crypto selects native Hyperliquid perps. HIP-3 selects builder-deployed contracts, which can also include crypto markets. These are perpetual contracts; Monitouring does not track spot markets.
The market universe and live price contexts come from Hyperliquid’s public API. Availability follows the exchange, so the number of cars can change.
How are the standings calculated?
Markets rank by percentage price change, from highest to lowest:
Change (%) = (current mark price / reference price − 1) × 100
The 24h view uses the exchange’s previous-day reference price. The 5m, 1h, 4h and 12h views use historical one-minute candle opens, then locally observed marks as history accumulates. References are rounded to the minute. Candle prices are trade prices, so these shorter-period changes approximate mark-price performance.
The ranking measures price change. It does not measure long/short positioning, order flow, portfolio returns or future performance.
Why can shorter periods show fewer markets?
History loads progressively and is cached in your browser. A market without a usable reference is excluded from that period until the data is available. Monitouring does not substitute a 24h change for a missing 5m or hourly value.
A delayed feed retains its last values and reports the delay. Reconnecting restores updates when the exchange feed is available. Historical data and network availability can differ between browsers.
Do car speed and gaps represent returns?
The order follows the market ranking. Driving speed, overtaking effects and the distances between cars are illustrative. Search for a market or select it in the standings to follow its car among nearby competitors.
The scenery repeats after 1 minute 58 seconds of running animation. This is a visual lap, not a reset of the selected performance window. Pause stops the animation while prices keep updating. Reduced-motion mode starts with a fixed wide camera and no driving animation.
The 3D race requires JavaScript and WebGL. Rendering is capped at 30 frames per second to limit graphics work.
What does “Spectators this month” count?
The counter reports the race’s monthly visitor total from Vercel Web Analytics, starting on the first day of the month in UTC. It refreshes every two minutes while the page is visible, using cached server responses. Vercel’s processing delay can affect when new visits appear.
This is an audience estimate, not a count of people watching right now. If analytics cannot be read, the counter displays a dash rather than an invented total.
How can I sponsor the race?
One sponsor appears across all trackside boards. Contact the creator on Telegram to agree your message and artwork. Sponsorship is arranged directly; there is no wallet connection or checkout on the site.
Project and data sources
Monitouring is an independent visualization, not an official Hyperliquid product. Follow the creator on X or join the Telegram community.